


Contents
Scroll to:
 A. L. Karpova,
A. V. Mostovoi,
M. A. Ponimanskaya,
O. N. Lee,
K. A. Desyatnik,
S. V. Martirosyan,
S. N. Kadyn,
N. Yu. Karpov,
A. A. Shichanina,
A. S. Kuznetsova
A. L. Karpova,
A. V. Mostovoi,
M. A. Ponimanskaya,
O. N. Lee,
K. A. Desyatnik,
S. V. Martirosyan,
S. N. Kadyn,
N. Yu. Karpov,
A. A. Shichanina,
A. S. Kuznetsova https://doi.org/10.17749/2313-7347/ob.gyn.rep.2025.622
Scroll to:
Introduction. Approximately 10 % of patients with preterm labor exhibits signs of intra-amniotic inflammation, which often occurs subclinically and results in increased risk of premature rupture of membranes (PROM).
Aim: to identify predictors of unfavorable perinatal outcomes associated with PROM.
Materials and Мethods. The single-center retrospective cohort study was conducted from January 1 to November 1, 2023 by enrolling patients between 28 0/7 and 36 6/7 weeks of gestation with PROM. A total of 176 maternal and neonatal medical records were analyzed. Two groups of neonates were identified: Group 1 – neonates with favorable outcomes at the time of hospital discharge; Group 2 – fetuses or neonates with unfavorable outcomes at discharge (including antenatal fetal death, neonatal death, grade 3 intraventricular hemorrhage, periventricular leukomalacia, severe bronchopulmonary dysplasia, or surgical-stage necrotizing enterocolitis). There were analyzed maternal medical histories, pregnancy and delivery data, amniotic fluid index (AFI), maximum vertical pocket of amniotic fluid, severity of respiratory failure and central hemodynamic disturbances in premature neonates, as well as incidence rates for those born to mothers with PROM. Multivariate analysis was conducted to identify factors associated with neonatal outcomes.
Results. Antenatal fetal death was recorded in 7 of 176 cases (3.9 %), and neonatal mortality among live-born infants comprised 7 of 169 (4.1 %). Median gestational age at delivery in Group 2 was 193.0 days [IQR: 180.0–198.0], significantly lower than in Group 1 (238.0 days [IQR: 223.5–247.0]; p < 0.001). Chorioamnionitis (p < 0.001) and anhydramnion (p = 0.003) were significantly more frequent in Group 2. Neonates in Group 2 required tracheal intubation (p < 0.001), surfactant therapy (p < 0.001), mechanical lung ventilation (p = 0.029), and high frequency oscillatory ventilation (p < 0.001) more often within the first 72 hours of life. NEOMOD (Neonatal Multiple Organ Dysfunction) scores were significantly higher in this group (p < 0.001). In Group 2, Ureaplasma parvum in nasopharyngeal swabs was more frequently found by using polymerase chain reaction (p = 0.015).
Conclusion. Predictors of adverse outcomes in fetuses and preterm neonates with PROM consisted of anhydramnios, chorioamnionitis, lower gestational age and birth weight, cesarean delivery, elevated maternal C-reactive protein (CRP) and white blood cell count prior to delivery, an AFI ≤ 32.0 mm, higher NEOMOD scores, presence of diffuse ecchymosis at birth, detection of neonatal Ureaplasma parvum, lower hemoglobin levels, as well as increased procalcitonin and CRP levels within the first 72 hours of life.
Karpova A.L., Mostovoi A.V., Ponimanskaya M.A., Lee O.N., Desyatnik K.A., Martirosyan S.V., Kadyn S.N., Karpov N.Yu., Shichanina A.A., Kuznetsova A.S. Predictors of unfavorable perinatal outcomes in premature rupture of membranes. Obstetrics, Gynecology and Reproduction. 2025;19(4):488-505. https://doi.org/10.17749/2313-7347/ob.gyn.rep.2025.622
Preterm labor (PL) worldwide is one of the major risk factors for fetal and neonatal adverse outcomes resulting in neonatal death in 70 % of cases, infant mortality – in 36 % of cases, and late pediatric neurological sequelae in 25–50 % of cases [1][2]. In 2020, PL rate in the Russian Federation was 59.9 thousand (total number of births was 1,220.8 thousand) [3]. Currently, a close relationship between PL and lower genital tract infection has been unambiguously established [4]. Upon this, one in 10 PL patients shows signs of intra-amniotic inflammation, subclinical in most cases that leads to a high risk of developing premature rupture of membranes (PROM) [5–7].
The leading role in PROM pathogenesis is played by extracellular matrix degradation along with amniotic membrane remodeling due to the infectious and inflammatory process [8]. Long-term persistent infection leads to emerging overt chorioamnionitis and fetal systemic inflammatory response syndrome [9]. Therefore, antibacterial therapy is indicated for PROM, because systemic antibiotics use is associated with markedly lowered incidence of chorioamnionitis, neonatal infection and perinatal mortality [10].
In 2017, W.H. Sim et al. emphasized dominance of neonatal sepsis as well as intraventricular hemorrhage (IVH), in PROM-related neonatal morbidity and mortality pattern at gestational age of < 24 weeks. Particularly, W.H. Sim et al. found that mean time interval between PROM onset and delivery ranged from 20 to 43 days. In case PROM occurred before 24 weeks of gestation, live birth rate comprised 63.6 %, whereas discharge survival rate was 44.9 %. Upon PROM, neonatal survival was better at later stages of pregnancy in case of sufficient amniotic fluid volume, and with maternal C-reactive protein (CRP) levels < 10.0 mg/L during the first 24 hours after hospitalization and PROM [9].
Prognostic role for residual amniotic fluid volume in PROM – amniotic fluid index (AFI) and/or maximum vertical pocket (MVP) magnitude have been currently of special interest [11]. Ultrasound (U/S) is widely used to assess amount of amniotic fluid and verify PROM (U/S) [9][11–17]. Globally, two approaches have been applied to U/S assess volume of amniotic fluid: MVP measurement [18][19] and AFI [20][21], both providing advantages over subjectively assessed parameter including those regarding predicting unfavorable perinatal outcomes [11].
А. Weissmann-Brenner et al. (2009) examined 102 singleton pregnancies with PROM and mean gestational age at PROM comprising 29.0 ± 5.3 weeks (range: 14.0–36.6 weeks), who concluded that at AFI < 10 cm, PROM was verified with sensitivity, specificity, positive and negative predictive values reaching 89.2, 88.5, 72.2 and 96.0 %, respectively. Mean AFI magnitude in PROM group and control group was 5.8 ± 3.6 cm (0.0–18.5 cm) and 13.7 ± 3.2 cm (7.3–24.4 cm) (p < 0.001), respectively [12].
Currently, a search for relationships between maternal and fetal outcomes in PROM-complicated pregnancies and AFI and/or MVP magnitude has been continued [11]. For instance, in 2019 E. Weiner et al. suggested that at admission to a third-level hospital PROM patients had amount of amniotic fluid independently associated with development of severe neonatal respiratory failure [14], which agrees with the data reported by W.H. Sim et al. (2017), where most common diseases in neonates born to mothers with PROM before 24 weeks of gestation were respiratory distress syndrome and bronchopulmonary dysplasia (BPD), whereas pulmonary hypoplasia was one of the most common causes of neonatal death [9].
S. Storness-Bliss et al. (2012) sought out for a relationship between maternal and fetal outcomes in PROM-complicated pregnancies at gestational age of < 24 weeks by dividing patients into 2 groups: group A – AFI ≥ 1 cm and group B – AFI < 1 cm (severe oligohydramnios). It was concluded that a larger volume of amniotic fluid after PROM was related to a better prognosis for the fetus, whereas time interval from PROM to delivery extended without increasing maternal complications rate [15]. S.T. Vermillion et al. (2000) suggest that increased risk of developing perinatal infection and shortening of time interval from PROM to delivery at gestational age of 24–32 weeks may occur more frequently if the AFI level after PROM was < 5 cm [16]. M. Bhagat and I. Chawla (2014) conducted the study aimed at assessing a relation between perinatal outcomes and AFI by focusing primarily at its level of < 5 cm and > 5 cm [17].
Taking into account the lack of consensus regarding the most prognostically relevant AFI and/or MVP level in PL with PROM, we attempted to conduct current study to identify objective predictors of adverse fetal and neonatal outcome.
Aim: to identify predictors of unfavorable perinatal outcomes associated with PROM.
A single-center retrospective cohort study enrolling women with PROM at 28 0/7 to 36 6/7 weeks of gestation was conducted at the Perinatal Center (PC), Vorokhobov City Clinical Hospital № 67, Moscow Healthcare Department. For this, pregnant women were hospitalized in the PC from 01.01.2023 to 01.11.2023 covering entire anhydrous interval from PROM onset. Paired children were treated in the PC from birth until discharge.
Inclusion criteria: gestational age > 28 0/7 to <3 7 0/7 weeks; required neonatal intensive care unit (NICU) transfer immediately after birth; history of long-term premature rupture of membranes (PROM) > 18 hours.
Exclusion criteria: congenital malformations that affect the outcome; chromosomal and/or genetic syndromes; transfer of a neonate to another clinic.
Obstetric history / Акушерский анамнез
Patient obstetric history was assessed for the following clinical and laboratory parameters: maternal age; number of pregnancies and births; gestational age at delivery (in days); anhydrous period duration (in hours); hyperthermia (> 37.5 °C) and tachycardia (more than 100 beats/min) in pregnant women before delivery; anhydramnios, chorioamnionitis (assessed by clinical criteria); cesarean section (CS); AFI at PC admission and before delivery; MVP before delivery (by U/S, mm; blood CRP level before and after delivery; cervical bacterial growth before delivery.
Amniotic fluid index measurement / Определение индекса амниотической жидкости
AFI measurement was conducted by conditionally dividing pregnant woman's abdomen area into four quadrants: pigmentation along the abdomen white line or linea nigra guide for conditionally dividing the abdomen into right and left halves; the navel and a horizontal line conditionally drawn through it serve as a guide for conditionally dividing the abdomen into lower and upper halves. Ultrasound device sensor was positioned strictly perpendicular to the surface of bed on which patient was located during examination. In each quadrant, MVP was measured. Depth of the maximum free pocket depth of amniotic fluid in each quadrant was assessed. Amniotic fluid index was calculated as the sum of the vertical lengths of MVP. Oligohydramnios was defined as AFI magnitude ≤ 5th percentile calculated for gestational age, polyhydramnios – as an AFI magnitude ≥ 95th percentile for gestational age [22].
Maximum vertical length of free pocket of amniotic fluid / Величина максимального вертикального размера свободного кармана околоплодных вод
MVP per se was measured in the right corner of the uterine contour, to be further divided into 3 categories: (a) < 2 cm – oligohydramnios; (b) a pocket depth of 2 to 8 cm – normal amniotic fluid amount; (c) a pocket depth of > 8 cm – polyhydramnios [18][19].
Severity of respiratory failure and central hemodynamic disorders / Определение тяжести дыхательной недостаточности и нарушений центральной гемодинамики
Respiratory failure (RF) severity in preterm neonates was assessed to calculate surfactant (poractant alfa) administration in delivery room at a standard dose of 200 mg/kg, repeated at a dose of 100 mg/kg; a need for invasive mechanical ventilation (IMV) or transfer to high frequency oscillatory ventilation (HFOV) in delivery room was taken into account; neonates were also assessed within the first 3 days of birth for maximum mean air way pressure (МАР) and fraction of inspired oxygen (FiO2). Neonatal hemodynamic impairment was assessed by using modified inotropic index (MII) [23]. Magnitude of neonatal multiple organ dysfunction syndrome (MODS) within the first 72 hours after birth was analyzed by using modified Neonatal Multiple Organ Dysfunction score (NEOMOD) [23][24].
Analysis of children morbidity / Анализ заболеваемости детей
Neonatal morbidity was assessed by the following nosology entities: early-onset neonatal sepsis [25], congenital pneumonia, pulmonary hemorrhage, pneumothorax, multiple skin ecchymoses and hemorrhages, surgical-stage retinopathy of prematurity, IVH grade 3, periventricular leukomalacia (PVL), severe BPD, surgical-stage necrotizing enterocolitis (NEC). The following neonatal laboratory parameters were selected for analysis [26][27]: blood leukocyte and normoblast counts, hemoglobin level and neutrophil index (NI) within the first 24 hours of life, procalcitonin (PCT) and CRP level, bacterial growth from sterile (blood) and non-sterile loci (nasopharynx and anus) within the first 3 days of life by using polymerase chain reaction (PCR).
A total of 176 birth histories and 176 medical records of preterm neonates were examined by dividing a cohort of examined children into 2 groups based on neonatal outcomes: group with favorable (Group 1) outcome and adverse (Group 2) outcome. The following study indicators were classified as adverse outcomes: antenatal fetal death, neonatal death, IVH grade 3, PVL, severe BPD, surgical-stage NEC (Fig. 1).
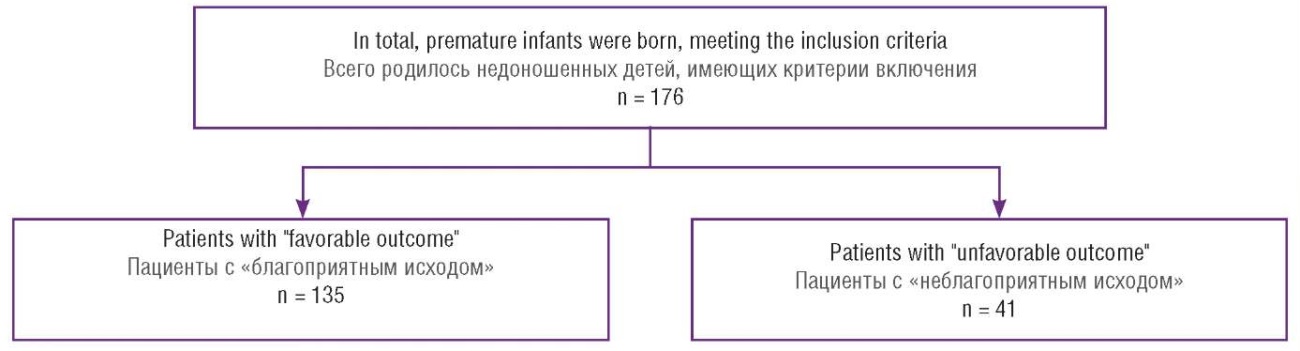
Figure 1. Flowchart of all premature patients born at the perinatal center from January 1, 2023 to November 1, 2023. Two final study groups were formed: Group 1 "favorable outcome" (n = 135) and Group 2 "unfavorable outcome" (n = 41) in the neonatal period.
Рисунок 1. Блок-схема учета всех недоношенных пациентов, рожденных в перинатальном центре за период с 01.01.2023 по 01.11.2023. Две заключительные группы исследования: группа 1 «благоприятный исход» (n = 135) и группа 2 «неблагоприятный исход» (n = 41) в неонатальном периоде.
The perinatal center doctors collected the data on study indicators and filled in the depersonalized database, which in turn included 180 parameters visualized using Microsoft Office Excel 2016 (Microsoft, USA). Data statistical processing was carried out using Python v 3.11 (USA). Normal distribution for study indicators was assessed using Shapiro–Wilk criterion. In case the data showed no normal distribution, nonparametric methods were used to obtain more accurate data. The following statistical indicators were determined:
Relative indicators were as follows:
To assess diagnostic value of quantitative indicators in predicting a certain outcome, including the probability of outcome calculated by using a regression model, the ROC curve analysis was used to determine optimal division of quantitative indicator magnitude allowing for classifying patients by degree of outcome risk, combining best sensitivity and specificity. Quality of the predictive model obtained by this method was assessed based on the area under the ROC curve with standard error and 95 % CI as well as level of statistical significance. Differences were considered statistically significant at p ≤ 0.05, using a two-sided p-level of significance.
Major quantitative obstetrical clinical and laboratory parameters assessed in pre- and postnatal period are shown in Table 1.
Table 1. Obstetric history (quantitative variables).
Таблица 1. Акушерский анамнез (количественные переменные).
|
Variables Переменные Ме [ Q1; Q3] |
Total Все |
Group 1 (favorable outcome) Группа 1 (благоприятный исход) |
Group 2 (unfavorable outcome) Группа 2 (неблагоприятный исход) |
p |
|
Maternal age, years Возраст матери, лет |
33.0 [ 28.0; 37.0] n = 176 |
33.0 [ 28.0; 37.0] n = 135 |
35.0 [ 29.0; 38.0] n = 41 |
0.228 |
|
The ordinal number of the pregnancy, n Порядковый номер беременности, n |
2.0 [ 1.0; 3.0] n = 176 |
2.0 [ 1.0; 3.5] n = 135 |
2.0 [ 1.0; 3.0] n = 41 |
0.471 |
|
The ordinal number of the birth, n Порядковый номер родов, n |
2.0 [ 1.0; 2.0] n = 176 |
2.0 [ 1.0; 2.0] n = 135 |
1.0 [ 1.0; 2.0] n = 41 |
0.315 |
|
Gestation age at delivery, days Срок беременности на момент родов, дней |
229.5 [ 205.0; 245.0] n = 176 |
238.0 [ 223.5; 247.0] n = 135 |
193.0 [ 180.0; 198.0] n = 41 |
< 0.001 |
|
Duration of membrane rupture, hours Длительность безводного промежутка, часы |
81.0 [ 47.0; 169.0] n = 176 |
79.0 [ 43.5; 160.5] n = 135 |
107.0 [ 65.0; 252.0] n = 41 |
0.073 |
|
Amniotic fluid index at admission to perinatal center, mm Индекс амниотической жидкости при поступлении в перинатальный центр, мм |
96.5 [ 60.0; 120.75] n = 138 |
100.0 [ 73.5; 125.5] n = 106 |
60.0 [ 31.5; 98.5] n = 32 |
< 0.001 |
|
Amniotic fluid index before delivery, mm Индекс амниотической жидкости перед родами, мм |
40.0 [ 30.0; 60.0] n = 79 |
45.0 [ 30.0; 64.25] n = 62 |
30.0 [ 20.0; 32.0] n = 17 |
< 0.001 |
|
Maximum vertical pocket before delivery, mm Максимальный вертикальный карман перед родами, мм |
19.0 [ 18.0; 41.0] n = 99 |
30.0 [ 18.0; 48.0] n = 77 |
18.0 [ 13.5; 18.0] n = 22 |
< 0.001 |
|
Maternal blood C-reactive protein level before delivery, mg/L Уровень С-реактивного белка в крови беременной перед родами, мг/л |
7.36 [ 3.52; 21.13] n = 163 |
6.14 [ 3.44; 17.14] n = 123 |
14.63 [ 4.91; 45.77] n = 40 |
0.008 |
|
Maternal blood leukocyte count before delivery, ×10⁹/L Количество лейкоцитов в крови беременной перед родами, ×10⁹/л |
12.1 [ 10.0; 15.15] n = 175 |
11.5 [ 9.83; 14.4] n = 134 |
13.6 [ 11.4; 16.4] n = 41 |
0.014 |
Regarding age, parity, ordinal number of deliveries and duration of the anhydrous interval pregnant women did not significantly differ between study groups. However, gestational age at the time of birth (days) in group with unfavorable outcome (Group 2) was significantly lower (p < 0.001) comprising 193.0 [ 180.0; 198.0] vs. 238.0 [ 223.5; 247.0] (Group 1) days, respectively. Blood CRP level and leukocyte count before delivery in Group 2 was significantly higher than in Group 1. AFI magnitude at admission to PC and immediately before delivery as well as MVP level before delivery were found to be significantly lower in Group 2 compared with Group 1.
Nonparametric variables characterizing the course of pregnancy and childbirth in the examined women are presented in Table 2.
Table 2. Obstetric history (nonparametric variables).
Таблица 2. Акушерский анамнез (непараметрические переменные).
|
Variables Переменные |
Total Все |
Group 1 (favorable outcome) Группа 1 (благоприятный исход) |
Group 2 (unfavorable outcome) Группа 2 (неблагоприятный исход) |
p |
OR ОШ Ме [ Q1; Q3] |
RR ОР Ме [ Q1; Q3] |
|
Route of delivery Вид родов |
n = 176 |
n = 135 |
n = 41 |
0.046* |
2.04 [ 1.01; 4.14]* |
1.19 [ 1.0; 1.42] |
|
Natural delivery, n (%) Роды естественным путем, n (%) |
101 (57.4) |
83 (61.5) |
18 (44.0) |
|||
|
Delivery by cesarean section, n (%) Роды путем операции кесарева сечения, n (%) |
75 (42.6) |
52 (38.5) |
23 (56.0) |
|||
|
Maternal fever > 37.5 ° C before delivery Наличие лихорадки у матери перед родами > 37,5 °С |
n = 176 |
n = 135 |
n = 41 |
0.083 |
5.25 [ 0.85; 32.57] |
1.94 [ 0.66; 5.69] |
|
No, n (%) / Нет, n (%) |
171 (97.2) |
133 (98.5) |
38 (93.0) |
|||
|
Yes, n (%) / Есть, n (%) |
5 (2.8) |
2 (1.5) |
3 (7.0) |
|||
|
Maternal tachycardia > 100 beats/min before delivery Наличие тахикардии у матери перед родами > 100 уд/мин |
n = 176 |
n = 135 |
n = 41 |
0.232 |
3.41 [ 0.47; 25.0] |
1.55 [ 0.58; 4.14] |
|
No, n (%) / Нет, n (%) |
172 (97.7) |
133 (98.5) |
39 (95.0) |
|||
|
Yes, n (%) / Есть, n (%) |
4 (2.3) |
2 (1.5) |
2 (5.0) |
|||
|
Anhydramnion Наличие ангидроамниона |
n = 176 |
n = 135 |
n = 41 |
0.003* |
32.52 [ 1.71; 617.67]* |
7.83 [ 0.56; 108.72] |
|
No, n (%) / Нет, n (%) |
172 (97.7) |
135 (100.0) |
37 (90.0) |
|||
|
Yes, n (%) / Есть, n (%) |
4 (2.3) |
0 (0) |
4 (10.0) |
|||
|
Chorioamnionitis Наличие хориоамнионита |
n = 176 |
n = 135 |
n = 41 |
< 0.001* |
8.85 [ 3.77; 20.77]* |
2.19 [ 1.4; 3.43]* |
|
No, n (%) / Нет, n (%) |
145 (82.4) |
123 (91.1) |
22 (54.0) |
|||
|
Yes, n (%) / Есть, n (%) |
31 (17.6) |
12 (8.9) |
19 (46.0) |
|||
|
Positive cervical canal bacterial culture before delivery Наличие роста бактерий из цервикального канала до родов |
n = 146 |
n = 109 |
n = 37 |
0.360 |
2.58 [ 0.56; 11.93] |
1.2 [ 0.97; 1.48] |
|
No, n (%) / Нет, n (%) |
16 (11.0) |
14 (12.8) |
2 (5.0) |
|||
|
Yes, n (%) / Есть, n (%) |
130 (89.0) |
95 (87.2) |
35 (95.0) |
Note: * – significant inter-group differences; OR – odds ratio; RR – relative risk.
Примечание: * – различия между группами 1 и 2 статистически значимы; ОШ – отношение шансов; ОР – относительный риск.
It turned out that surgical delivery via CS was required significantly more often in group with unfavorable neonatal outcome (Group 2). Antenatal fetal death was recorded in 7 of 176 (4.0 %) cases (Group 2). Fever (> 37.5 °C), tachycardia (> 100 beats/min), as well as bacterial growth from the cervical canal in pregnant women before delivery were recorded in both groups with near similar rate. However, it was noteworthy that pregnant women in Group 2 were significantly more often diagnosed with chorioamnionitis (p < 0.001) and anhydramnios (p = 0.003).
Quantitative clinical characteristics of premature neonates are presented in Table 3.
Table 3. Clinical characteristics of the examined neonates (quantitative data).
Таблица 3. Клинические характеристики обследованных новорожденных (количественные данные).
|
Variables Переменные Ме [ Q1; Q3] |
Total Все |
Group 1 (favorable outcome) Группа 1 (благоприятный исход) |
Group 2 (unfavorable outcome) Группа 2 (неблагоприятный исход) |
p |
|
Weight, g Масса тела, г |
1980.0 [ 1335.0; 2362.5] n = 176 |
2120.0 [ 1820.0; 2530.0] n = 135 |
930.0 [ 750.0; 1075.0] n = 41 |
< 0.001 |
|
Gestational age, weeks Гестационный возраст, недель |
33.0 [ 29.75; 35.0] n = 176 |
34.0 [ 32.0; 35.0] n = 135 |
28.0 [ 26.0; 28.0] n = 41 |
< 0.001 |
|
Apgar score at 1 minute, points Оценка по шкале Апгар на 1-й минуте, баллы |
7.0 [ 6.0; 7.0] n = 175 |
7.0 [ 7.0; 8.0] n = 134 |
5.0 [ 1.0; 6.0] n = 41 |
< 0.001 |
|
Apgar score at 5 minutes, points Оценка по шкале Апгар на 5-й минуте, баллы |
8.0 [ 7.0; 8.0] n = 175 |
8.0 [ 7.0; 8.0] n = 134 |
6.0 [ 3.0; 7.0] n = 41 |
< 0.001 |
In Group 2 (unfavorable outcome), gestational age, birth weight, and Apgar score were significantly lower than in Group 1. No significant difference in sex bias between the children in both groups was found: 78 out of 135 (57.8 %) and 27 out of 41 (66.0 %) in Groups 1 and 2, respectively (OR = 1.41 [ 0.68; 2.93]; OR = 1.08 [ 0.92; 1.27]; p = 0.356). In total, 105 out of 176 (59.7 %) boys and 71 out of 176 (40.3 %) girls were enrolled in the study.
The major clinical characteristics describing respiratory failure severity in the examined children from both groups are presented in Table 4.
Table 4. Major clinical characteristics for respiratory failure severity in the examined neonates (nonparametric variables).
Таблица 4. Основные клинические характеристики тяжести дыхательной недостаточности у обследованных детей (непараметрические переменные).
|
Variables Переменные |
Total Все |
Group 1 (favorable outcome) Группа 1 (благоприятный исход) |
Group 2 (unfavorable outcome) Группа 2 (неблагоприятный исход) |
p |
OR ОШ Ме [ Q1; Q3] |
RR ОР Ме [ Q1; Q3] |
|
Tracheal intubation in delivery room Интубация трахеи в родильном зале |
n = 169 |
n = 135 |
n = 34 |
< 0.001* |
21.58 [ 8.05; 57.84]* |
2.06 [ 1.53; 2.77]* |
|
Without tracheal intubation in delivery room, n (%) Интубации трахеи в родильном зале не было, n (%) |
117 (69.2) |
111 (82.2) |
6 (18.0) |
|||
|
Tracheal intubation in delivery room, n (%) Была интубация трахеи в родильном зале, n (%) |
52 (30.8) |
24 (17.8) |
28 (82.0) |
|||
|
Surfactant administration in delivery room Введение сурфактанта в родильном зале |
n = 169 |
n = 135 |
n = 34 |
< 0.001* |
26.35 [ 6.06; 114.64]* |
1.59 [ 1.34; 1.89]* |
|
Without surfactant administration, n (%) Сурфактант не вводился, n (%) |
86 (50.9) |
84 (62.2) |
2 (6.0) |
|||
|
Surfactant administration, n (%) Сурфактант вводился, n (%) |
83 (49.1) |
51 (37.8) |
32 (94.0) |
|||
|
Repeated surfactant administration Повторное введение сурфактанта |
n = 169 |
n = 135 |
n = 34 |
0.031* |
5.87 [ 1.25; 27.62]* |
1.9 [ 0.81; 4.48] |
|
Without repeated surfactant administration, n (%) Сурфактант повторно не вводился, n (%) |
162 (95.9) |
132 (97.8) |
30 (88.0) |
|||
|
Repeated surfactant administration, n (%) Сурфактант повторно вводился, n (%) |
7 (4.1) |
3 (2.2) |
4 (12.0) |
|||
|
Required endotracheal MV within the first 72 hours of life Потребность в ИВЛ через ЭТТ в возрасте первых 72 часов |
n = 169 |
n = 135 |
n = 34 |
0.029* |
2.8 [ 1.21; 6.48]* |
1.29 [ 1.0; 1.67] |
|
Required endotracheal MV < 72 hours, n (%) Потребность в ИВЛ менее 72 часов, n (%) |
135 (79.9) |
113 (83.7) |
22 (65.0) |
|||
|
Required endotracheal MV > 72 hours, n (%) Потребность в ИВЛ более 72 часов, n (%) |
34 (20.1) |
22 (16.3) |
12 (35.0) |
|||
|
HFOV onset at age of the first 72 hours Старт ВЧО ИВЛ в возрасте первых 72 часов |
n = 169 |
n = 135 |
n = 34 |
< 0.001* |
21.5 [ 7.45; 62.01]* |
3.39 [ 1.7; 6.76]* |
|
Without HFOV within > 72 hours, n (%) Без ВЧО ИВЛ в течение первых 72 часов жизни, n (%) |
146 (86.4) |
129 (95.6) |
17 (50.0) |
|||
|
Required HFOV within the first 72 hours, n (%) С ВЧО ИВЛ в течение первых 72 часов жизни, n (%) |
23 (13.6) |
6 (4.4) |
17 (50.0) |
Note: * – significant inter-group differences; OR – odds ratio; RR – relative risk; MV – mechanical ventilation; ETT – endotracheal tube; HFOV – high frequency oscillatory ventilation.
Примечание: * – различия между группами 1 и 2 статистически значимы; ОШ – отношение шансов; ОР – относительный риск; ИВЛ – искусственная вентиляция легких; ЭТТ – эндотрахеальная трубка; ВЧО ИВЛ – высокочастотная ИВЛ.
Children in Group 2 vs. Group 1 were characterized by significantly more severe RF course while assessing all clinical indicators related to RF severity: children more often required tracheal intubation (p < 0.001) and surfactant administration (p < 0.001) in delivery room; demonstrated a more pronounced need for routine mechanical lung ventilation through endotracheal tube (p = 0.029) and for transfer to HFOV (p < 0.001) within the first 72 hours of life. In delivery room, surfactant was administered to children usually at the 10th minute after birth (Table 5).
Table 5. Major indicators assessing severity of respiratory failure, multiple organ failure and approaches to surfactant therapy in premature neonates (quantitative indicators).
Таблица 5. Основные показатели тяжести дыхательной недостаточности, полиорганной недостаточности и подходов к сурфактантной терапии у новорожденных младенцев (количественные показатели).
|
Variables Переменные Ме [ Q1; Q3] |
Total Все |
Group 1 (favorable outcome) Группа 1 (благоприятный исход) |
Group 2 (unfavorable outcome) Группа 2 (неблагоприятный исход) |
p |
|
Age at administration of first dose of surfactant, minutes Возраст при введении первой дозы сурфактанта, минут |
10.0 [ 10.0; 15.0] n = 82 |
10.0 [ 10.0; 15.0] n = 50 |
10.0 [ 10.0; 10.0] n = 32 |
0.093 |
|
Maximum FiO2 during first 72 hours of life Maксимальный уровень FiO2 в первые 72 часа жизни |
0.25 [ 0.21; 0.4] n = 169 |
0.21 [ 0.21; 0.3] n = 135 |
0.4 [ 0.35; 1.0] n = 34 |
< 0.001 |
|
Maximum MAP during first 72 hours of life, cm H2O Maксимальный уровень МАР в первые 72 часа жизни, см вод. ст. |
13.0 [ 11.0; 15.0] n = 28 |
12.0 [ 10.75; 14.25] n = 8 |
13.0 [ 11.75; 15.0] n = 20 |
0.292 |
|
NEOMOD score during first 72 hours of life, points Оценка по шкале NEOMOD в первые 72 часа жизни, баллы |
2.0 [ 1.75; 4.0] n = 140 |
2.0 [ 1.0; 2.0] n = 107 |
5.0 [ 4.0; 6.0] n = 33 |
< 0.001 |
|
Maximum level of modified inotropic index during first 72 hours of life Максимальный уровень модифицированного инотропного индекса в первые 72 часа жизни |
41.0 [ 22.25; 66.75] n = 26 |
30.0 [ 19.0; 41.0] n = 7 |
50.0 [ 29.0; 80.0] n = 19 |
0.193 |
Note: FiO2 – fraction of inspired oxygen; MAP – mean airway pressure.
Примечание: FiO2 – фракция ингаляционного кислорода; МАР – среднее давление в дыхательных путях.
RF severity in premature neonates during early neonatal period is characterized by the need for applying additional oxygen during respiratory therapy, MAP level as well as requiring repeated surfactant administration within the first 72 hours of life. The latter was significantly more often (p = 0.031) required in Group 2 (Table 4). Moreover, children in Group 2 required significantly higher FiO2 (p < 0.001). A need for cardiotonic support assessed by comparing peak MII values within the first 72 hours of life, did not differ significantly in both groups; related NEOMOD scale assessment revealed a more prominent MODS severity in Group 2 (p < 0.001), which undoubtedly affected neonatal morbidity (Table 6).
Table 6. Morbidity in examined children (nonparametric variables).
Таблица 6. Заболеваемость обследованных детей (непараметрические переменные).
|
Variables Переменные |
Total Все |
Group 1 (favorable outcome) Группа 1 (благоприятный исход) |
Group 2 (unfavorable outcome) Группа 2 (неблагоприятный исход) |
p |
OR ОШ Ме [ Q1; Q3] |
RR ОР Ме [ Q1; Q3] |
|
Congenital pneumonia Врожденная пневмония |
n = 168 |
n = 134 |
n = 34 |
0.697 |
1.16 [ 0.55; 2.46] |
1.03 [ 0.88; 1.2] |
|
No, n (%) / Нет, n (%) |
89 (53.0) |
72 (53.7) |
17 (50.0) |
|||
|
Yes, n (%) / Есть, n (%) |
79 (47.0) |
62 (46.3) |
17 (50.0) |
|||
|
Intravitreal ranibizumab administration for prematurity retinopathy treatment Интровитреальное введение ранибизумаба для лечения ретинопатии недоношенных |
n = 169 |
n = 135 |
n = 34 |
0.001* |
39.98 [ 2.1; 762.39]* |
8.16 [ 0.59; 113.28] |
|
No, n (%) / Нет, n (%) |
165 (97.6) |
135 (100.0) |
30 (88.0) |
|||
|
Yes, n (%) / Есть, n (%) |
4 (2.4) |
0 (0) |
4 (12.0) |
|||
|
Pneumothorax Наличие пневмоторакса |
n = 169 |
n = 135 |
n = 34 |
0.040* |
20.85 [ 0.98; 444.88] |
4.84 [ 0.38; 60.85] |
|
No, n (%) / Нет, n (%) |
167 (98.8) |
135 (100.0) |
32 (94.0) |
|||
|
Yes, n (%) / Есть, n (%) |
2 (1.2) |
0 (0) |
2 (6.0) |
|||
|
Pulmonary hemorrhage Легочное кровотечение |
n = 169 |
n = 135 |
n = 34 |
0.008* |
30.11 [ 1.52; 597.86]* |
6.49 [ 0.49; 86.85] |
|
No, n (%) / Нет, n (%) |
166 (98.2) |
135 (100.0) |
31 (91.0) |
|||
|
Yes, n (%) / Есть, n (%) |
3 (1.8) |
0 (0) |
3 (9.0) |
|||
|
Multiple ecchymoses and cutaneous hemorrhages since birth Множественные экхимозы и геморрагии на коже с рождения |
n = 169 |
n = 135 |
n = 34 |
< 0.001* |
61.81 [ 3.38; 1128.65]* |
11.57 [ 0.8; 167.4] |
|
No, n (%) / Нет, n (%) |
163 (96.4) |
135 (100.0) |
28 (82.0) |
|||
|
Yes, n (%) / Есть, n (%) |
6 (3.6) |
0 (0) |
6 (18.0) |
|||
|
Positive blood culture Наличие положительного бактериального высева из крови |
n = 166 |
n = 133 |
n = 33 |
1.000 |
1.32 [ 0.05; 33.14] |
1.06 [ 0.47; 2.37] |
|
No, n (%) / Нет, n (%) |
165 (99.4) |
132 (99.2) |
33 (100.0) |
|||
|
Yes, n (%) / Есть, n (%) |
1 (0.6) |
1 (0.8) |
0 (0) |
|||
|
Positive bacterial culture in non-sterile loci (nasopharynx, anus) Рост бактерий в нестерильных локусах (зев, анус) |
n = 168 |
n = 135 |
n = 33 |
0.228 |
0.6 [ 0.26; 1.39] |
0.91 [ 0.79; 1.05] |
|
No, n (%) / Нет, n (%) |
107 (63.7) |
83 (61.5) |
24 (73.0) |
|||
|
Yes, n (%) / Есть, n (%) |
61 (36.3) |
52 (38.5) |
9 (27.0) |
|||
|
Verified Ureaplasma parvum infection Инфекция, вызванная Ureaplasma рarvum |
n = 168 |
n = 135 |
n = 33 |
0.015* |
3.61 [ 1.32; 9.88]* |
1.44 [ 0.97; 2.13] |
|
No, n (%) / Нет, n (%) |
149 (88.7) |
124 (91.9) |
25 (76.0) |
|||
|
Yes, n (%) / Есть, n (%) |
19 (11.3) |
11 (8.1) |
8 (24.0) |
Note: * – significant inter-group differences; OR – odds ratio; RR – relative risk.
Примечание: * – различия между группами 1 и 2 статистически значимы; ОШ – отношение шансов; ОР – относительный риск.
Children in Group 2 were more likely to develop multiple dermal ecchymoses and hemorrhages from birth (p < 0.001), pulmonary hemorrhage (p = 0.008), pneumothorax (p = 0.040), and surgical-stage retinopathy of prematurity (p = 0.001). Blood bacterial growth was reported only in 1 of 166 (0.6 %) children, from non-sterile foci (nasopharynx and anus) – in 61 of 168 (36.3 %) neonates. No significant differences between Groups 1 and 2 in bacterial growth from non-sterile loci (p = 0.228) were found. It is worth noting that in Group 2 vs. Group 1, Ureaplasma рarvum was significantly more often detected in the nasopharyngeal samples by PCR (p = 0.015).
Lethal outcome in total patient cohort was recorded in 7 of 169 (4.1 %) cases observed only in Group 2, with fatality rate for 7 of 34 children born alive comprising 21.0 % (OR = 73.91 [ 4.1; 1332.5]; OR = 11.57 [ 0.8; 167.4]). All children, IVH grade 3 among was recorded in 3.6 % (6 of 169 children) of cases, with that of found in Group 2 in 18.0 % (6 of 34 children) (OR = 61.81 [ 3.38; 1128.65]; OR = 11.57 [ 0.8; 167.4]). Surgical-stage NEC in total patient cohort during neonatal period manifested in 1 of 169 (0.6 %) children and, accordingly, in 1 of 34 (3.0 %) children in Group 2 (OR = 12.13 [ 0.48; 304.48]; OR = 3.21 [ 0.29; 35.44]). BPD incidence (oxygen requirement at 36 0/7 weeks of postconceptional age) was 7.1 % in total group (12 of 169 children) and 35.0 % – in Group 2 (12 of 34 children) (OR = 150.56 [ 8.61; 2633.61]; OR = 22.3 [ 1.47; 338.11]).
The indicators related to neonatal morbidity and outcomes in both groups were combined with temporal inflammation marker changes (Table 7).
Table 7. Laboratory assay data in premature neonates (parametric data).
Таблица 7. Результаты лабораторных методов исследования у недоношенных новорожденных детей (параметрические данные).
|
Variables Переменные Ме [ Q1; Q3] |
Total Все |
Group 1 (favorable outcome) Группа 1 (благоприятный исход) |
Group 2 (unfavorable outcome) Группа 2 (неблагоприятный исход) |
p |
|
Blood leukocyte count during first 24 hours of life, ×10⁹/L Количество лейкоцитов в крови в первые 24 часа жизни, ×10⁹/л |
13.45 [ 10.5; 18.0]. n = 152 |
13.2 [ 10.7; 17.3] n = 119 |
14.4 [ 9.5; 20.2] n = 33 |
0.439 |
|
Neutrophil index during first 24 hours of life Нейтрофильный индекс в первые 24 часа жизни |
0.08 [ 0.05; 0.15] n = 148 |
0.07 [ 0.06; 0.14] n = 115 |
0.1 [ 0.04; 0.2] n = 33 |
0.370 |
|
Blood hemoglobin level during first 24 hours of life, g/L Уровень гемоглобина в крови в первые 24 часа жизни, г/л |
170.5 [ 154.75; 189.0] n = 152 |
178.0 [ 159.5; 191.5] n = 119 |
157.0 [ 145.0; 164.0] n = 33 |
< 0.001 |
|
Blood procalcitonin level at age < 24 hours of life, ng/mL Уровень прокальцитонина в крови в возрасте < 24 часов жизни, нг/мл |
0.3 [ 0.19; 0.64] n = 122 |
0.26 [ 0.17; 0.62] n = 92 |
0.36 [ 0.3; 0.69] n = 30 |
0.017 |
|
Blood procalcitonin level at age of ≥ 24 – < 48 hours of life, ng/mL Уровень прокальцитонина в крови в возрасте ≥ 24 – < 48 часов жизни, нг/мл |
10.55 [ 2.19; 21.59] n = 30 |
4.78 [ 2.10; 18.00] n = 21 |
12.49 [ 10.0; 36.90] n = 9 |
0.175 |
|
Blood procalcitonin level at age of 48 to 72 hours of life, ng/mL Уровень прокальцитонина в крови в возрасте от 48 до 72 часов жизни, нг/мл |
1.57 [ 0.59; 5.3] n = 71 |
1.22 [ 0.43; 3.12] n = 52 |
3.81 [ 1.75; 9.89] n = 19 |
0.007 |
|
Blood C-reactive protein level at age < 24 hours of life, mg/L Уровень С-реактивного белка в крови в возрасте < 24 часов жизни, мг/л |
1.57 [ 0.49; 3.24] n = 141 |
1.54 [ 0.54; 3.14] n = 109 |
1.81 [ 0.20; 3.25] n = 32 |
0.794 |
|
Blood C-reactive protein level at age of ≥ 24 – < 48 hours of life, mg/L Уровень С-реактивного белка в крови в возрасте ≥ 24 – < 48 часов жизни, мг/л |
2.91 [ 1.29; 5.43] n = 29 |
1.74 [ 0.95; 4.52] n = 20 |
5.43 [ 3.85; 11.41] n = 9 |
0.015 |
|
Blood C-reactive protein level at age of ≥ 48 до – < 72 hours of life, mg/L Уровень С-реактивного белка в крови в возрасте ≥ 48 – < 72 часов жизни, мг/л |
2.56 [ 0.92; 4.48] n = 87 |
2.5 [ 0.96; 3.97] n = 66 |
2.76 [ 0.84; 5.31] n = 21 |
0.893 |
Blood leukocyte count and NI during the first 24 hours of life in both groups were comparable whereas hemoglobin level in Group 2 was significantly lower (p < 0.001). Blood PCT and CRP level during the first 72 hours of life showed different patterns, however, both inflammation markers in children of Group 2 were significantly elevated. For instance, PCT magnitude during the first day of life in Group 2 was significantly higher (p = 0.017), that later (at the age of 24 to 48 hours after birth) became comparable with that of in Group 1, sustaining significantly higher magnitude in Group 2 at the age of 72 hours (p = 0.007). Blood CRP levels mirroring higher disease incidence in Group 2 were also significantly elevated in neonates with unfavorable outcomes between 24 and 48 hours after birth (p = 0.015). However, it was comparable in both groups during the first 24 hours and 48 to 72 hours of life.
To assess the impact of anhydrous interval duration on neonatal outcomes, a Spearman correlation analysis was performed (Table 8).
Table 8. Correlation analysis for quantitative data in study groups.
Таблица 8. Корреляционный анализ количественных данных в зависимости от групп исследования.
|
Variable 1 Переменная 1 |
Variable 2 Переменная 2 |
Total Все |
Group 1 (favorable outcome) Группа 1 (благоприятный исход) |
Group 2 (unfavorable outcome) Группа 2 (неблагоприятный исход) |
|||
|
Rs |
p |
Rs |
p |
Rs |
p |
||
|
Duration of rupture of membranes, hours Длительность безводного промежутка, часы |
Maximum FiO2 in first 72 hours of life, cm Н2О Maксимальный уровень FiO2 в первые 72 часа жизни, см вод. ст. |
0.230 |
0.003 |
0.168 |
0.052 |
0.168 |
0.343 |
|
Duration of rupture of membranes, hours Длительность безводного промежутка, часы |
NEOMOD score in first 72 hours of life, points Оценка по шкале NEOMOD в первые 72 часа жизни, баллы |
0.243 |
0.004 |
0.170 |
0.079 |
0.248 |
0.165 |
|
Duration of rupture of membranes, hours Длительность безводного промежутка, часы |
Blood hemoglobin level in first 24 hours, g/L Уровень гемоглобина крови в первые 24 часа, г/л |
–0.253 |
0.002 |
–0.196 |
0.033 |
–0.225 |
0.209 |
|
Duration of rupture of membranes, hours Длительность безводного промежутка, часы |
Blood procalcitonin level in < 24 hours of life, ng/mL Уровень прокальцитонина крови в возрасте до 24 часов жизни, нг/мл |
0.262 |
0.004 |
0.317 |
0.002 |
–0.169 |
0.373 |
Note: FiO2 – fraction of inspired oxygen; Rs – Spearman's rank correlation coefficient.
Примечание: FiO2 – фракция ингаляционного кислорода; Rs – коэффициент ранговой корреляции Спирмена.
It was found out that anhydrous interval length impacts on neonatal outcomes more prominently in total patient cohort rather than specifically in each group. The longer anhydrous interval, the more significantly more often children subsequently required application of additional oxygen supply, had a higher NEOMOD score during the first three days of life, significantly lower blood hemoglobin levels and higher PCT magnitude during the first day of life.
Prenatal amniotic fluid index magnitude was found to be most powerful predictor of unfavorable outcome. This parameter determines unfavorable outcome with ROC-AUC accuracy = 0.791 (Table 9, Fig. 2). The study demonstrated that a cut-off level for unfavorable outcome was equal to 32.0 mm, i.e., if prenatal AFI ≤ 32.0 mm, then the probability for unfavorable outcome was higher; if prenatal AFI > 32.0 mm, then adverse outcome was observed at lower rate. The groups with unfavorable and favorable outcomes differed significantly in AFI levels before delivery > 32.0 mm (p = 0.001): group with unfavorable outcome: AFI before delivery ≤ 32.0 mm – 13 (76.47 %), AFI before delivery > 32.0 mm – 4 (23.53 %); group with favorable outcome: AFI before delivery ≤ 32.0 mm – 20 (32.26 %), AFI before delivery > 32.0 mm – 42 (67.74 %); OR = 6.82 [ 1.97; 23.58], p = 0.001.
Table 9. Metrical parameters for evaluating quality of a predictor variable.
Таблица 9. Метрики оценки качества предикторной переменной.
|
Assessed by / Мера оценки |
Value / Значение Ме [ Q1; Q3] % |
|
ROC-AUC |
79.1 [ 69.6; 87.7] |
|
Accuracy / Точность |
69.6 [ 60.8; 78.5] |
|
Sensitivity (1) / Чувствительность (1) |
67.7 [ 57.8; 77.9] |
|
Specificity (0) / Специфичность (0) |
76.5 [ 58.8; 93.3] |
|
ROC ± Se |
79.1 ± 0.0019 |
Note: AUC – area under the curve; ROС – receiver operator characteristic; Se – sensitivity.
Примечание: AUC – площадь под кривой; ROС – характеристика оператора приемника; Se – чувствительность.
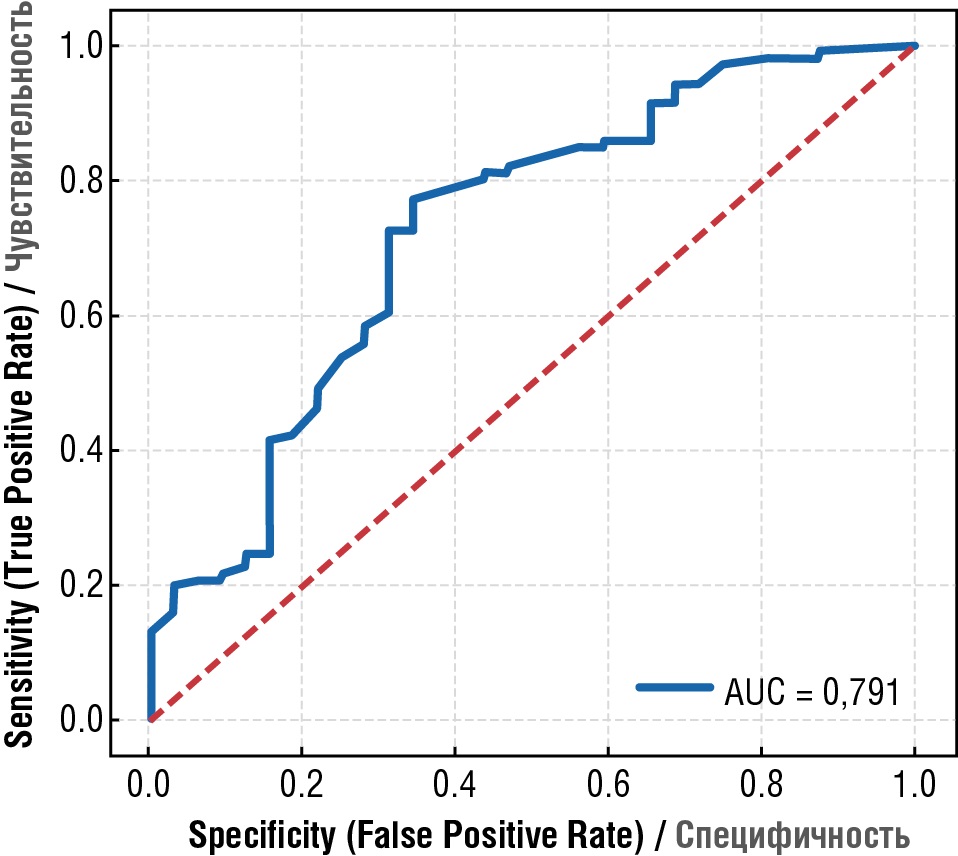
Figure 2. Prenatal amniotic fluid index ≤ 32 mm as a predictor for adverse outcome, ROC-AUC accuracy = 0.791.
Рисунок 2. Индекс амниотической жидкости перед родами ≤ 32 мм может служить предиктором неблагоприятного исхода с точностью ROC-AUC = 0,791.
Here, we set out to seek for predictors of adverse outcome in case of PROM development in PL. It allowed to reveal several clinical and laboratory variables that may be used in clinical practice as markers for fetal and neonatal negative prognosis. Unfavorable outcome in the fetus and premature neonate was significantly more often combined with obstetric indicators such as low gestational age and birth body weight, manifestations of lacked amniotic fluid (anhydramnios) and inflammatory process (chorioamnionitis), the need for delivery by CS, high CRP magnitude, as well as leukocytosis in pregnant women with PROM at the time of delivery, AFI before delivery ≤ 32.0 mm.
Low gestational age and lower birth weight objectively lead to a worse prognosis in premature neonates, as evidenced by numerous studies published in Russia and globally [28][29]. For instance, N. Younge et al. (2017) showed that among neonates born at 220–236 weeks of gestation, mortality within a few weeks was 97–98 %, so that as few as 1.0 % survived without neurodevelopmental disorders; among those born at 240–246 weeks of gestation, 55 % of neonates survive, but only 32 % had no neurological deficits at the age of 18–22 months of life [30].
Chorioamnionitis [9] and oligo- and anhydramnios are highlighted as most typical PROM-related maternal medical issues, with the latter often being combined with the need for CS delivery [17] that agrees with our data. It is worth noting that chorioamnionitis was significantly more common in children with unfavorable outcome that was not observed for fever in pregnant women before delivery, i.e. chorioamnionitis in some cases was diagnosed in the absence of fever. This finding was reported earlier as a subclinical chorioamnionitis accompanied by the lack of typical clinical symptoms, including fever. In this case, a subclinical infection may manifest, i.e., as a premature prenatal rupture of the membranes [31][32].
Elevated maternal CRP level before delivery we found in group with unfavorable outcome that was also paralleled with higher chorioamnionitis incidence further corroborate the data demonstrating that CRP is the most accurate marker of infectious and inflammatory diseases (sensitivity is 68.7 %, specificity is 77.1 %) [33]. Of special importance is the data on prenatal amniotic fluid index magnitude that turned out to be the strongest predictor of unfavorable outcome, which probability is higher if the prenatal AFI is ≤ 32.0 mm (ROC-AUC = 0.791). The studies discuss various AFI levels ranging from 1 to 10 cm used as prognostic criteria for maternal and neonatal outcomes [9][12][15–17]; however, prenatal AFI ≤ 32.0 mm found by us was first determined as a strong predictor for fetal and neonatal negative prognosis. A retrospective study by E.J. Okonek et al., conducted in the USA and published in April 2025, also parallels with our data on respiratory outcomes, particularly highlighting a need for frequent HFOV use, mechanical lung ventilation, surfactant administration, and treatment of pulmonary hypertension [34].
Thus, women with PROM are recommended to be referred to hospitals able to provide high-technology respiratory support to preterm neonates.
Not surprisingly, Group 2 neonates in our study were significantly more likely to exhibit MODS (including more severe RF) from birth, as evidenced by lower Apgar scores at the end of the 1st and 5th minutes of life, a higher need for invasive respiratory support starting in delivery room, for repeated surfactant administration, supplemental oxygen, and higher MAP scores at first 72 hours of life. We found that a more frequent combination of widespread ecchymosis in premature neonates at birth with adverse outcome may be considered as a negative prognosis predictor. Similar pattern we also observed for higher PCT and CRP magnitude in children during the first 72 hours of life as well as for lower hemoglobin level within the first 24 hours after birth and negative outcomes. A certain discovery was also that Ureaplasma рarvum was significantly more often detected in the nasopharyngeal swabs in children with negative prognosis.
The limitations of our work were presented by retrospective study design which infer errors in data collection as well as the lack of chorioamnionitis histological verification. In terms of further prospective studies to validate the identified predictors, especially in multicenter cohorts, it is essential to take into account verification of chorioamnionitis diagnosis not only clinically, but also to align with histological data, especially in case of examining fever-free mothers.
It may be concluded that lower gestational age and birth weight, anhydramnios and chorioamnionitis, CS, higher preterm CRP level and leukocyte count as well as AFI before delivery ≤ 32.0 mm are the major predictors for unfavorable perinatal outcomes in premature rupture of membranes. Severe hypoxia at birth and severity of multiple organ dysfunction, severe RF and postnatal multiple ecchymoses, neonatal Ureaplasma parvum, lower hemoglobin levels, and higher PCT and CRP levels during the first 72 hours of life are associated with unfavorable outcomes.
1. Davey M.A., Watson L., Rayner J.A., Rowlands S. Risk scoring systems for predicting preterm birth with the aim of reducing associated adverse outcomes. Cochrane Database Syst Rev. 2011;(11):CD004902. https://doi.org/10.1002/14651858.CD004902.pub4. Update in: Cochrane Database Syst Rev. 2015;(10):CD004902. https://doi.org/10.1002/14651858.CD004902.pub5.
2. Ancel P.-Y., Lelong N., Papiernik E. et al.; EUROPOP. History of induced abortion as a risk factor for preterm birth in European countries: results of the EUROPOP survey. Hum Reprod. 2004;19(3):734–40. https://doi.org/10.1093/humrep/deh107.
3. Healthcare in Russia. 2021. Statistical Digest. [Zdravoohranenie v Rossii. 2021. Statisticheskij sbornik]. Moscow: Rosstat, 2021. 171 p. (In Russ.).
4. 2022 exceptional surveillance of preterm labour and birth (NICE guideline NG25). London: National Institute for Health and Care Excellence (NICE), 2022 Aug 4. Available at: https://www.ncbi.nlm.nih.gov/books/NBK591661/. [Accessed: 25.02.2025].
5. Romero R., Miranda J., Chaiworapongsa T. et al. Prevalence and clinical significance of sterile intra-amniotic inflammation in patients with preterm labor and intact membranes. Am J Reprod Immunol. 2014;72(5):458–74. https://doi.org/10.1111/aji.12296.
6. Gomez-Lopez N., Romero R., Panaitescu B. et al. Inflammasome activation during spontaneous preterm labor with intra-amniotic infection or sterile intra-amniotic inflammation. Am J Reprod Immunol. 2018;80(5):e13049. https://doi.org/10.1111/aji.13049.
7. Boyle A.K., Rinaldi S.F., Norman J.E., Stock S.J. Preterm birth: inflammation, fetal injury and treatment strategies. J Reprod Immunol. 2017;119:62–6. https://doi.org/10.1016/j.jri.2016.11.008.
8. Keelan J.A. Intrauterine inflammatory activation, functional progesterone withdrawal, and the timing of term and preterm birth. J Reprod Immunol. 2018;125:89–99. https://doi.org/10.1016/j.jri.2017.12.004.
9. Sim W.H., Araujo Júnior E., Da Silva Costa F., Sheehan P.M. Maternal and neonatal outcomes following expectant management of preterm prelabour rupture of membranes before viability. J Perinat Med. 2017;45(1):29–44. https://doi.org/10.1515/jpm-2016-0183.
10. Kenyon S., Pike K., Jones D.R. et al. Childhood outcomes after prescription of antibiotics to pregnant women with preterm rupture of the membranes: 7-year follow-up of the ORACLE I trial. Lancet. 2008;372(9646):1310–8. https://doi.org/10.1016/S0140-6736(08)61202-7.
11. Nabhan A.F., Abdelmoula Y.A. Amniotic fluid index versus single deepest vertical pocket as a screening test for preventing adverse pregnancy outcome. Cochrane Database Syst Rev. 2008;2008(3):CD006593. https://doi.org/10.1002/14651858.CD006593.pub2.
12. Weissmann-Brenner A., O'Reilly-Green C., Ferber A., Divon M.Y. Values of amniotic fluid index in cases of preterm premature rupture of membranes. J Perinat Med. 2009;37(3):232–5. https://doi.org/10.1515/JPM.2009.078.
13. Thomson A.J.; Royal College of Obstetricians and Gynaecologists. Care of women presenting with Suspected preterm prelabour rupture of membranes from 24+0 weeks of gestation: Green-top Guideline No. 73. BJOG. 2019;126(9):e152–e166. https://doi.org/10.1111/1471-0528.15803.
14. Weiner E., Barrett J., Zaltz A. et al. Amniotic fluid volume at presentation with early preterm prelabor rupture of membranes and association with severe neonatal respiratory morbidity. Ultrasound Obstet Gynecol. 2019;54(6):767–73. https://doi.org/10.1002/uog.20257.
15. Storness-Bliss C., Metcalfe A., Simrose R. et al. Correlation of residual amniotic fluid and perinatal outcomes in periviable preterm premature rupture of membranes. J Obstet Gynaecol Can. 2012;34(2):154–8. https://doi.org/10.1016/S1701-2163(16)35158-1.
16. Vermillion S.T., Kooba A.M., Soper D.E. Amniotic fluid index values after preterm premature rupture of the membranes and subsequent perinatal infection. Am J Obstet Gynecol. 2000;183(2):271–6. https://doi.org/10.1067/mob.2000.107653.
17. Bhagat M., Chawla I. Correlation of amniotic fluid index with perinatal outcome. J Obstet Gynaecol India. 2014;64(1):32–5. https://doi.org/10.1007/s13224-013-0467-2.
18. Chamberlain P.F., Manning F.A., Morrison I. et al. Ultrasound evaluation of amniotic fluid volume. I. The relationship of marginal and decreased amniotic fluid volumes to perinatal outcome. Am J Obstet Gynecol. 1984;150(3):245–9. https://doi.org/10.1016/s0002-9378(84)90359-4.
19. Manning F.A., Platt L.D., Sipos L. Antepartum fetal evaluation: development of a fetal biophysical profile. Am J Obstet Gynecol. 1980;136(6):787–95. https://doi.org/10.1016/0002-9378(80)90457-3.
20. Phelan J.P., Ahn M.O., Smith C.V. et al. Amniotic fluid index measurements during pregnancy. J Reprod Med. 1987;32(8):601–4.
21. Phelan J.P., Smith C.V., Broussard P., Small M. Amniotic fluid volume assessment with the four-quadrant technique at 36-42 weeks' gestation. J Reprod Med. 1987;32(7):540–2.
22. Moore T.R., Cayle J.E. The amniotic fluid index in normal human pregnancy. Am J Obstet Gynecol. 1990;162(5):1168–73. https://doi.org/10.1016/0002-9378(90)90009-v.
23. Karpova A.L., Mostovoy A.V., Prutko E.E. et al. Interleukin-6 as an indicator for the severity of the multiple organ dysfunction syndrome in preterm infants weighing less than 1500 g: a retrospective cohort study. [Interlejkin-6 kak indikator tyazhesti poliorgannoj nedostatochnosti u nedonoshennyh detej s massoj tela menee 1500 g: retrospektivnoe kogortnoe issledovanie]. Pediatriya imeni G.N. Speranskogo. 2023;102(1):54–63. (In Russ.). https://doi.org/10.24110/0031-403X-2023-102-1-54-63.
24. Karpova A.L., Mostovoy A.V., Bagaeva Z.E. et al. The NEOMOD scale in predicting the outcomes in newborns with birth weigh less than 1500 grams: a retrospective cohort study. [Shkala NEOMOD v prognozirovanii iskhodov u novorozhdennyh detej s massoj tela menee 1500 grammov: retrospektivnoe kogortnoe issledovanie]. Anesteziologiya i reanimatologiya. 2024;(2):49–57. (In Russ.). https://doi.org/10.17116/anaesthesiology202402149.
25. Karpova A.L., Mostovoi A.V., Dudkina E.A. et al. Early neonatal sepsis in COVID-19 era. [Rannij neonatal'nyj sepsis v epohu COVID-19]. Obstetrics, Gynecology and Reproduction. 2023;17(3):284–98. (In Russ.). https://doi.org/10.17749/2313-7347/ob.gyn.rep.2023.389.
26. Karpova A.L. Complete blood count: reference intervals for full term and late premature infants in the first day of life (part I). [Obshchij analiz krovi: referensnye intervaly dlya donoshennyh i pozdnih nedonoshennyh novorozhdennyh detej v pervye sutki zhizni (chast' I)]. Pediatriya imeni
27. G.N. Speranskogo. 2022;101(1):62–70. (In Russ.). https://doi.org/10.24110/0031-403X-2022-101-1-62-70.
28. Karpova A.L., Mostovoi A.V., Borodich A.V. et al. General blood test: reference values for full-term and late preterm newborns in the first day of life (part II). [Obshchij analiz krovi: referensnye intervaly dlya donoshennyh i pozdnih nedonoshennyh novorozhdennyh detej v pervye sutki zhizni (chast' II)]. Pediatriya imeni G.N. Speranskogo. 2025;104(1):24–33. (In Russ.). https://doi.org/10.24110/0031-403X-2025-104-1-24-33.
29. Mustafin T.A., Karpova A.L., Mostovoi A.V., Kolesnikov A.N. Clinical and laboratory indicators of lethal outcome in premature newborns with body weigh less than 1500 grams. [Kliniko-laboratornye indikatory letal'nogo iskhoda u nedonoshennyh novorozhdennyh s massoj tela menee 1500 g]. Neonatologiya: novosti, mneniya, obuchenie. 2021;9(3):9–15. (In Russ.). https://doi.org/10.33029/2308-2402-2021-9-3-9-15.
30. Mostovoi A.V., Karpova A.L., Kharitonova N.R. et al. Morbidity and predictors lethal outcome in premature infants who received poractant alfa with gestational age of less than 32 weeks. [Zabolevaemost' i prediktory letal'nogo iskhoda u nedonoshennyh novorozhdennyh s gestacionnym vozrastom menee 32 nedel', poluchivshih poraktant al'fa raznymi metodami]. Pediatriya imeni G.N. Speranskogo. 2022;101(1):27–38. (In Russ.). https://doi.org/10.24110/0031-403X-2022-101-1-27-38.
31. Younge N., Goldstein R.F., Bann C.M. et al.; Eunice Kennedy Shriver National Institute of Child Health and Human Development Neonatal Research Network. Survival and neurodevelopmental outcomes among periviable infants. N Engl J Med. 2017;376(7):617–28. https://doi.org/10.1056/NEJMoa1605566.
32. Buscicchio G., Giannubilo S.R., Bezzeccheri V. et al. Computerized analysis of the fetal heart rate in pregnancies complicated by preterm premature rupture of membranes (pPROM). J Matern Fetal Neonatal Med. 2006;19(1):39–42. https://doi.org/10.1080/14767050500361505.
33. Vandenbroucke L., Doyen M., Le Lous M. et al. Chorioamnionitis following preterm premature rupture of membranes and fetal heart rate variability. PLoS One. 2017;12(9):e0184924. https://doi.org/10.1371/journal.pone.0184924.
34. Cataño Sabogal C.P., Fonseca J., García-Perdomo H.A. Validation of diagnostic tests for histologic chorioamnionitis: Systematic review and meta-analysis. Eur J Obstet Gynecol Reprod Biol. 2018;228:13–26. https://doi.org/10.1016/j.ejogrb.2018.05.043.
35. Okonek E.J., Schulz E.V., Belzer K. et al. Neonatal survival and outcomes following periviable rupture of membranes. Am J Perinatol. 2025;42(5):649–59. https://doi.org/10.1055/a-2414-1006.
Anna L. Karpova - MD, PhD.
2/44 Salyama Adilya Str., Moscow 123423; 2/1 bldg. 1, Barrikadnaya Str., Moscow 123993; 5 Revolutsionnaya Str., Yaroslavl 150000
Scopus Author ID 57197280474
Aleksei V. Mostovoi - MD, PhD.
2/44 Salyama Adilya Str., Moscow 123423; 2/1 bldg. 1, Barrikadnaya Str., Moscow 123993; 5 Revolutsionnaya Str., Yaroslavl 150000
Scopus Author ID 57201723894, Wos ResearcherID AAR-7908-2021
Maria A. Ponimanskayа - MD, PhD.
2/44 Salyama Adilya Str., Moscow 123423
Ok N. Lee - MD, PhD.
2/44 Salyama Adilya Str., Moscow 123423
Kirill A. Desyatnik - MD.
2/44 Salyama Adilya Str., Moscow 123423
Sergei V. Martirosyan - MD, PhD.
145 Kashtanovaya Alleya, Kaliningrad 236023; 1 Alexander Nevsky Str., Kaliningrad 236041
Svetlana N. Kadyn - MD.
2/44 Salyama Adilya Str., Moscow 123423
Nikolai Yu. Karpov - MD.
104 Komsomolskaya Str., Tutaev, Yaroslavl Region 152303
Anna A. Shichanina - MD.
1 Leninskie Gory, Moscow 119234
Anna S. Kuznetsova - MD.
1 Leninskie Gory, Moscow 119234
What is already known about this subject?
► Premature rupture of membranes (PROM) accounts for approximately 30 % of all preterm births. The use of antibiotics and corticosteroids can prolong the latency period and improve perinatal outcomes.
► PROM is often combined with the development of manifest chorioamnionitis and systemic inflammatory reaction syndrome in the fetus by worsening neonatal outcomes.
► PROM poses a significant challenge in obstetrics, especially at early gestational ages. Early detection, close monitoring, and timely intervention can improve outcomes for both the mother and the neonate.
What are the new findings?
► Unfavorable perinatal outcomes were statistically significantly more often combined with higher blood C-reactive protein (CRP) level and leukocyte count in pregnant women with PROM before childbirth, as well as the amniotic fluid index (AFI) before delivery < 32.0 mm.
► The presence of widespread ecchymosis in premature infants at birth can be considered as a negative prognosis predictor.
► Ureaplasma parvum was detected significantly more often in newborns with poor outcomes.
How might it impact on clinical practice in the foreseeable future?
► The prenatal AFI < 32.0 mm can be used in routine practice as one of the most objective risk factors for unfavorable perinatal outcomes.
► Our study confirmed the presence of chorioamnionitis without maternal fever, suggesting that greater attention should be paid to subclinical forms of intra-amniotic infection.
► Active prevention of Ureaplasma parvum will improve outcomes in premature infants.
Karpova A.L., Mostovoi A.V., Ponimanskaya M.A., Lee O.N., Desyatnik K.A., Martirosyan S.V., Kadyn S.N., Karpov N.Yu., Shichanina A.A., Kuznetsova A.S. Predictors of unfavorable perinatal outcomes in premature rupture of membranes. Obstetrics, Gynecology and Reproduction. 2025;19(4):488-505. https://doi.org/10.17749/2313-7347/ob.gyn.rep.2025.622

![]()


